
To run a successful hotel, you need to know your numbers. Not only that, you need to know the right numbers—your key performance indicators (KPIs). There’s no point celebrating high occupancy if your bottom line is falling through the floor. Your numbers need to tell you how many guests are coming, how much profit you’re making, and how your property stacks up against the competition.
Here are six fundamental metrics every hotelier should keep a close eye on.
RevPAR
RevPAR (revenue per available room) gives you the average revenue generated per available room at your property. To find this number, take your total room revenue for the night (or specified time period) and divide it by the number of available rooms in your hotel, both sold and unsold.
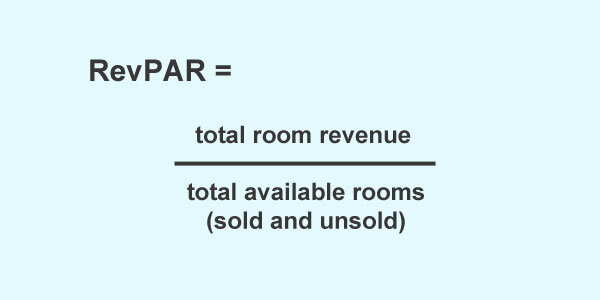
For example, if you made $2,500 in one night, and you have 20 rooms, your RevPAR for the day would be $125.
RevPAR can help you understand how well your pricing strategy is working to fill rooms over a given period. Work out the minimum RevPAR you need to be profitable—if it dips below that or is falling compared to your running average, you need to investigate.
To increase RevPAR, you’ll have to raise your occupancy and/or rate. Revenue management software can determine whether a rate increase is a good idea. It integrates with your property management system (PMS) and calculates the ideal price for your hotel based on availability, demand, seasonality, competitor pricing, and more.
Note that RevPAR only considers room revenue; it doesn’t take into account extras like meals, spa services, or gift shop sales. To see how your ancillary revenue fits in, compare your RevPAR with your TRevPAR (total revenue per available room), which is all your operating revenue divided by total available rooms.
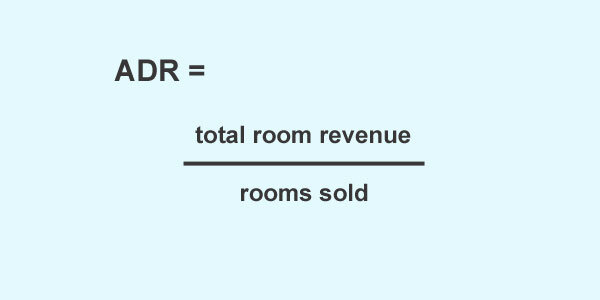
Average Daily Rate (ADR)
Your average daily rate (ADR) shows you the average amount of revenue you receive from each sold room. Unlike RevPAR, this metric does not include unsold rooms. For instance, if 6 of those 20 rooms (see above) went unsold, they would be left out of the equation, and the ADR would be $2,500 (total room revenue) divided by 14 (sold rooms) or approximately $178.
However, like RevPar, ADR does not take into account anything apart from room revenue. If a guest purchased a meal or spa treatment, that would not be included in the ADR calculation.
This metric is key for determining revenue strategy and making rate changes. Looking at it alongside RevPAR can prevent you from discounting rates too much to increase occupancy. Know how high your ADR needs to be to make a profit and take action if it falls below that.
To improve this metric, you would have to raise your rates and/or encourage your guests to upgrade to your more expensive suites. This is where your amenities come in. Show guests the value they’re receiving for their money. Maybe that super premium deluxe suite comes with a complimentary breakfast…
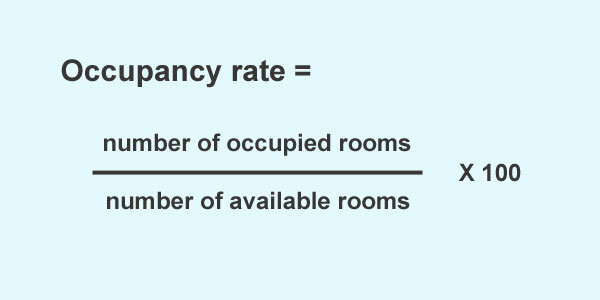
Occupancy Rate
This one is fairly straightfoward. It’s the percentage of rooms with people in them on any given night or period. In the example above, the occupancy rate would be 14 (the number of occupied rooms) divided by 20 (the total number of available rooms). That gives you 0.7 or 70 percent.
In general, you want high occupancy rates. However, sometimes it is more profitable to have a slightly lower occupancy rate but charge more per room. It’s important to view your occupancy rate in context with ADR and RevPAR to get an accurate picture of your property’s performance.
Effective branding increases occupancy without necessarily dropping prices. Use your property management system to mine your guest data and figure out who your audience is. Don’t try to sell conference room space to honeymoon couples. Consider what makes you unique. What do you have that other hotels in your category don’t?
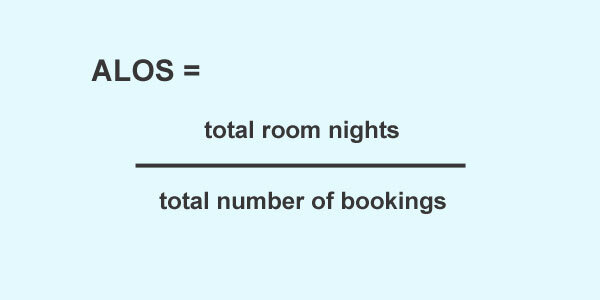
Average Length of Stay (ALOS)
This metric is what it sounds like, the average number of nights that guests stay during a specific time period. You find this number by dividing the number of room nights booked by the number of reservations. For instance, if our example hotel had 30 room nights booked and 10 reservations, their ALOS would be three nights per guest during that time period. Leisure focused hotels tend to have higher ALOS than hotels that focus on business travel. If you’re checking into a Caribbean resort, you want to stay a while…
Overall, you want your ALOS to remain high to reduce room turnover costs and the total bookings you have to generate. Finding new customers can be hard and expensive (marketing costs money!), so why not have your existing ones stay longer?
Looking at your ALOS can also help you figure out seasonal booking patterns and the best time to fit in hotel maintenance. Knowing these booking patterns enables you to implement an effective pricing strategy.
Market Penetration Index (MPI)
This is a measurement for how you stack up against the competition. It tells you how much of the area business you’re getting and whether that’s more or less than your fair share.
To calculate your MPI, take your occupancy rate and divide it by the average occupancy rate for your competitors (you’ll need to subscribe to a data service to find out that second variable), then multiply by 100.
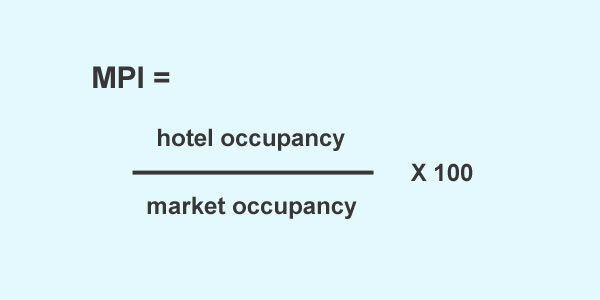
For example, say our theoretical hotel has an occupancy rate of 70 percent while their competitors have an occupancy rate of 75 percent. Their MPI would be 93. If our theoretical hotel was getting its fair share of business, their MPI should be 100. Over 100 is even better (more than their fair share), but under 100 means the hotel is underperforming compared to the competition.
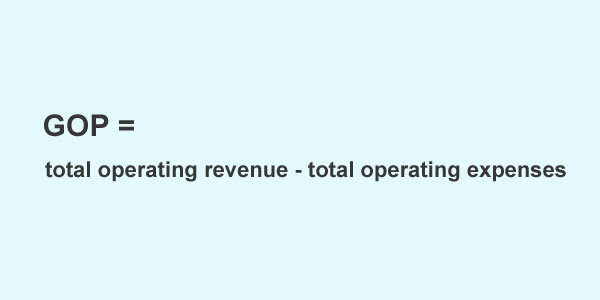
Gross Operating Profit (GOP)
Gross operating profit (GOP) tells you how profitable your property is. To work this one out, take your total hotel revenue for the month (or specified time period) and subtract your total operating expenses. It includes both room revenue and ancillary revenue. If a guest buys a spa treatment, that would count here. It’s the same with expenses; you add up everything needed to run your property: labor, maintenance, those little mints you have at reception, etc. The only costs you leave out are costs that don’t go directly towards operating your property, e.g., taxes.
To improve GOP, your revenue has to increase, or your expenses have to decrease. On the expenses side, you can cross-train staff to reduce labor costs rather than hire more people (but beware of staff burnout, which could lead to high turnover costs). Leaning into sustainability can also lower the money you’re spending in the long run, in addition to attracting new, environmentally savvy guests.
These numbers aren’t something to calculate once a year. Look at them regularly and track them over time to identify problems quickly and meet your property’s performance goals. WebRezPro property management system ensures you always have the numbers you need. It automatically tracks your property’s performance in real time and keeps you informed via standard and customizable reports as well as a convenient dashboard that displays your daily occupancy rates, ADR, and RevPAR. It couldn’t be easier to monitor your metrics, so you can make the right decisions to grow your business!
